07

CT

Cynthia McCollough (left), Colin Orton (right)
01

This gallery was developed by Cynthia McCollough and Colin Orton and is partly derived from a video presentation produced by Cynthia McCollough.

1963
02

Particle physicist Allan Cormack laid the theoretical basis for CT imaging by publishing work that demonstrated the ability to determine the inner structure of an object from attenuation line integrals through the object.

Source: Cormack AM. Representation of a function by its line integrals, with some radiological applications. J Appl Phys. 1963; 34:2722.

1968
03

The British company Electric and Musical Industries (EMI) was well known for their development of stereophonic sound, broadcast television devices, and radar, as well as for its production of the Beatles records.

In the mid-1960s, at EMI’s Central Research Laboratory in west London, radar-operator-turned-electrical-engineer Godfrey Hounsfield began to consider whether he could reconstruct a three-dimensional representation of an object from gamma-ray transmission measurements taken through the object. He used a computer simulation to test his theory, and in 1968, he proposed a project to “… investigate the employment of a computer to make better use of the information obtained when an object is examined by gamma rays or X-rays.” This diagram is from the proposal.

Source: Beckmann EC. CT scanning the early days. The British journal of radiology. 2006 Jan;79(937):5-8.

1968
04a

Original lathe bed scanner and a brain specimen in an acrylic block. Projection data were  reconstructed on an ICL 1905 mainframe computer.

Source: Beckmann EC. CT scanning the early days. The British journal of radiology. 2006 Jan;79(937):5-8.

1969
04b

Image of a brain specimen with a suprasellar tumor and spots of calcium taken November 5, 1969, using the lathe bed scanner. The data were archived on 90 meters of punched paper tape

Source: Beckmann EC. CT scanning the early days. The British journal of radiology. 2006 Jan;79(937):5-8.

1971
05

Based on the experimental validation of his computer simulations, Hounsfield obtained financial support from the UK’s Department of Health and Social Security to develop the CAT scanner.

The first test system was installed at Atkinson Morley’s Hospital in Wimbledon, London, UK.  The system is shown here with its inventor, Godfrey Hounsfield.

Source: ESSR_Pub_Godfrey-Hounsfield.pdf

1971
06a

On October 1st, 1971, radiologist James Ambrose performed the first patient CAT scan at Atkinson Morley’s Hospital in London, England. The patient was a woman with a suspected frontal lobe tumor.

Source: http://www.impactscan.org/CThistory.htm

1973
06b

Images from a patient scanned at the Mayo Clinic. A complete head CT exam consisted of six axial images recorded using a Polaroid camera.

Source: Cynthia McCollough, Mayo Clinic

1971
07a

The EMI Scanner installed at Atkinson Morley’s Hospital.


Source: https://collection.sciencemuseumgroup.org.uk/objects/co134790/emi-ct-brain-scanner-ct-scanner

07b

EMI Scanner now on display at the British Science Museum.

Source: https://collection.sciencemuseumgroup.org.uk/objects/co134790/emi-ct-brain-scanner-ct-scanner

1971
08

The EMI scanner used a translate–rotate geometry, whereby the x-ray tube and detector were mounted opposite one another, with the patient’s head placed between them. The tube and detector together translated across the width of the patient’s head in one direction, after which the frame on which they were secured rotated by 1°; the tube and detector were then translated back across the patient’s head in the other direction. These processes were repeated until the device had rotated 180° around the patient. This became known as the first generation of CT scanners. Typically, six axial images of the brain took about 30 minutes to be generated with this technology.

Source: Boone J, McCollough, CH. Computed Tomography Turns 50. Physics Today. 2021; 74(9):34.

1972
09

In a last-minute substitution in the program, the first patient images acquired on the EMI scanner were shown at a neuroradiology course at Albert Einstein College of Medicine in New York in May 1972.

The enthusiastic response led EMI to show their scanner at the RSNA Annual Meeting, Chicago in November 1972. Hounsfield and Ambrose presented their work in an invited talk, given  immediately after the president’s symposium, and received a standing ovation.

Source (program cover): Radiological Society of North American history section

Source (photographs): Raymond Schultz

1972
10

Marketing brochure for the EMI Mark 1 CAT scanner and a listing of its specifications.

Source: EMI Scanner sales brochure from Department of Radiology, Mayo Clinic

1972
11

A photograph of the EMI operator console and a photograph of the inside of the scanner gantry.

Source: EMI Scanner sales brochure from Department of Radiology, Mayo Clinic

1973
12

In June of 1973, the first commercial EMI scanner was installed at Mayo Clinic in Rochester, MN. The first CT scan in North America was performed there on June 19, 1973.

The unit, serial number 1, is on display in Mayo’s Department of Radiology.

Shown behind the scanner is an image acquired of the first patient and, to the left of the scanner, a photograph of how a patient was situated in the scanner.

Source: Cynthia McCollough, Mayo Clinic

1974
13

To decrease the scan time, the pencil beam was widened into a small fan, allowing larger angular rotation of the gantry. This translate-rotate geometry is considered the second generation of CT scanners.

Source: Goldman LW. Principles of CT and CT technology. J Nucl Med Technol. 2007 Sep;35(3):115-28.

1974
14a

An autographed brochure for the second-generation EMI head scanner is shown.

Source: https://healthcare-in-europe.com/en/news/the-legacy-of-the-man-who-pioneered-computed-tomography.html

1974
14b

Godfrey Hounsfield and James Ambrose standing next to the EMI Scanner CT1010.

Source: https://regi.tankonyvtar.hu/hu/tartalom/tamop425/0019_1A_Orvosi_lekepezestechnika/ch12s02.html

1974
15

On February 15th, Robert S. Ledley filed a patent for the ACTA (Automated, Computerized, Transverse Axial) scanner. Pfizer later obtained the rights to manufacture this unit from Georgetown University. Although earlier machines scanned only the head, this machine was much faster and allowed body scanning. It was a 2nd generation design with 30 photomultiplier tubes and performed a scan with only nine translate-rotate acquisitions. A scan took about 20 seconds and produced an axial image with a 256 x 256 matrix.

Source: Illustration from patent application (PATENT NO – US 3,922,552 DIAGNOSTIC X-RAY SYSTEMS)

1974
16

The first full-body CAT scanner developed by Robert Ledley was installed at Georgetown University Medical Center. The 0100 ACTA Scanner used a second-generation geometry and was the first to employ gantry angulation, laser positioning, and Fourier reconstruction. The success of the body scanner caught the interest of many other potential manufacturers. At one point, as many as 23 companies manufactured CAT scanners, which now are referred to simply as CT scanners since they are no longer restricted to only axial imaging.

Source: https://www.washingtonpost.com/local/obituaries/robert-s-ledley-physicist-who-invented-first-full-body-ct-scanner-dies-at-86/2012/07/26/gJQA0TxaCX_story.html

1975
17

A CT scan of the abdomen acquired using the first EMI body CT scanner.

Source: Sheedy 2nd PF, Stephens DH, Hattery RR, Muhm JR, Hartman GW. Computed tomography of the body: initial clinical trial with the EMI prototype. American Journal of Roentgenology. 1976 Jul 1;127(1):23-51.

1975
18

GE introduced a third generation of scanner geometry in a system with 288 detectors. In the rotate–rotate geometry, an array of detectors is placed opposite an x-ray tube that emits a fan-shaped beam. Both the tube and the detectors rotate synchronously around the patient to acquire data. Producing significantly shorter scan times, this geometry is used in all commercial CT scanners today.

Source: Reproduced from John Boone and Cynthia McCollough, “Computed Tomography Turns 50”, Physics Today 74, 9, 34 (2021)

1975
19

CT mammography was first explored by the Mayo Clinic in collaboration with General Electric.

Source: Gisvold JJ, Karsell PR, Reese EC. Clinical evaluation of computerized tomographic mammography. Mayo Clinic Proceedings. 1977 Mar;52(3):181-185.

1977
20

CT’s ability to visualize patient anatomy in a manner that also quantified the x-ray attenuation properties of human tissue provided invaluable data for radiation therapy treatment planning.

Source: Geise RA, McCullough EC. The use of CT scanners in megavoltage photon-beam therapy planning. Radiology. 1977 Jul;124(1):133-41.  

1978
21

The fourth generation rotate–stationary geometry made use of a stationary, ring-shaped detector array. The fan-shaped x-ray beam rotated around the patient within the detector ring. The expensive detector array, less dose-efficient geometry, and limited ability to block scattered radiation led to abandonment of this geometry.

Source: Reproduced from John Boone and Cynthia McCollough, “Computed Tomography Turns 50”, Physics Today 74, 9, 34 (2021)

1979
22

The use of xenon ionization chambers provided a solution to the  ring artifacts common to 3rd generation scanners. The xenon detector array consisted of a large chamber that was filled with high pressure (10-25 atm) xenon gas and separated into many small charge collection volumes by thin metal plates called septa. Every second septum was connected to a common positive bias voltage source. Alternate septa acted as collectors, each connected to a separate electronic readout. This solution was introduced by Martin Yaffe and Harold Johns at the Princess Margaret Hospital in Toronto, Canada. The xenon detector arrays were inherently stable because factors that might affect individual detector responses were uniform for the entire array and constant over time, reducing ring artifacts caused by variations in detector sensitivity. Xenon arrays were eventually replaced in 3rd generation systems by solid-state scintillating detectors, which were considerably more dose efficient.

Source: M. Yaffe, H. E. Johns, “An Experimental Computed Tomographic (CT) Scanner,” Proc. SPIE 0173, Application of Optical Instrumentation in Medicine VII, (6 July 1979)

1979
23

The fifth generation of CT scanner geometry used a stationary x-ray detector and stationary semicircular tungsten anode that formed an arc around the patient. X-rays were produced using a scanning electron beam. The system required no mechanical motion and was able to scan the entire left ventricle in 50 milliseconds, enabling the clinical use of cardiac CT. Electron beam CT was also used to quantify the amount of coronary artery calcification and was used to demonstrate that coronary calcification is an independent predictor of risk for future cardiac events. This “ultrafast” CT technology was also the first to scan the entire  thorax or abdomen in a single breath hold.

Source: D. P. Boyd, R. G. Gould, J. R. Quinn, R. Sparks, J. H. Stanley and W. B. Herrmannsfeldt, “A Proposed Dynamic Cardiac 3-D Densitometer for Early Detection and Evaluation of Heart Disease,” in IEEE Transactions on Nuclear Science, vol. 26, no. 2, pp. 2724-2727, April 1979

1979
24

The 1979 Nobel Prize in Physiology or Medicine was awarded to Allen M. Cormack and Godfrey N. Hounsfield “for the development of computer assisted tomography.“

Source: https://www.nobelprize.org/prizes/medicine/1979/summary/

25

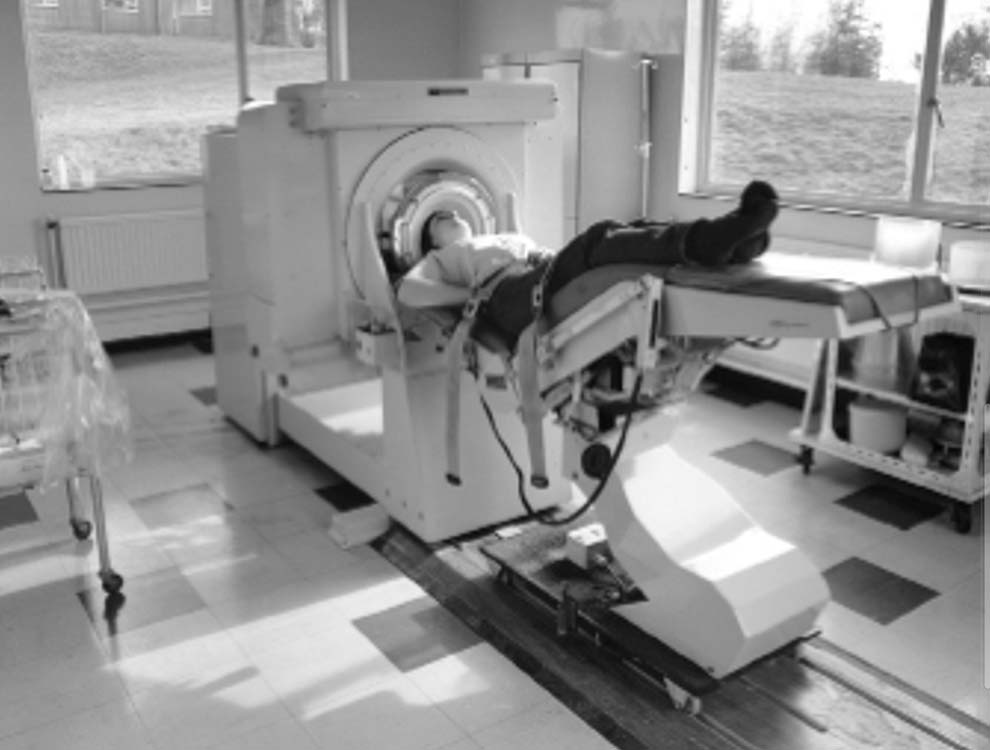
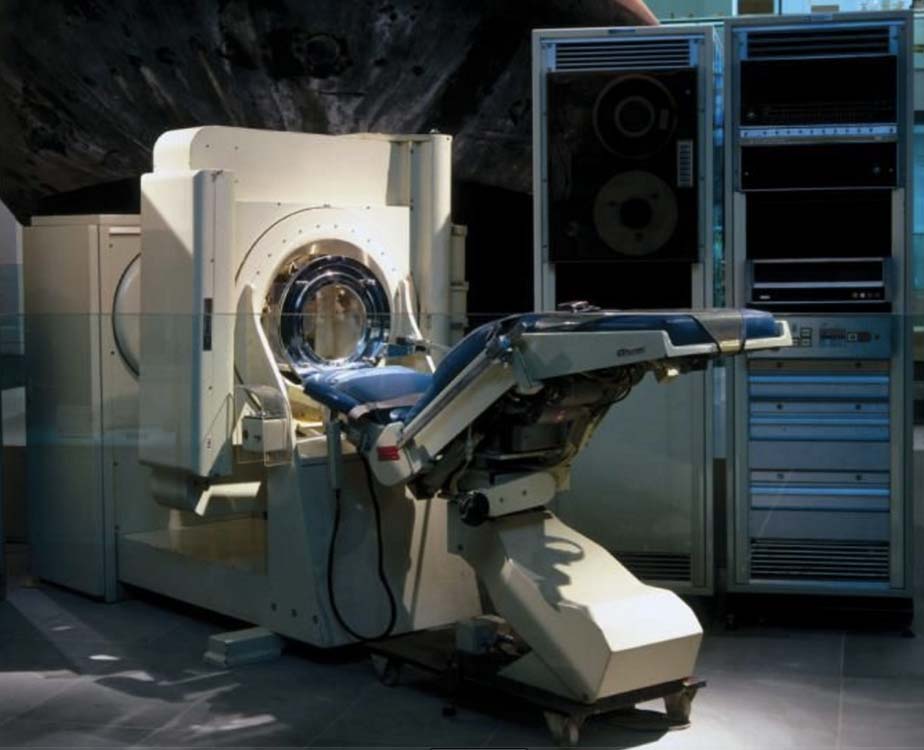
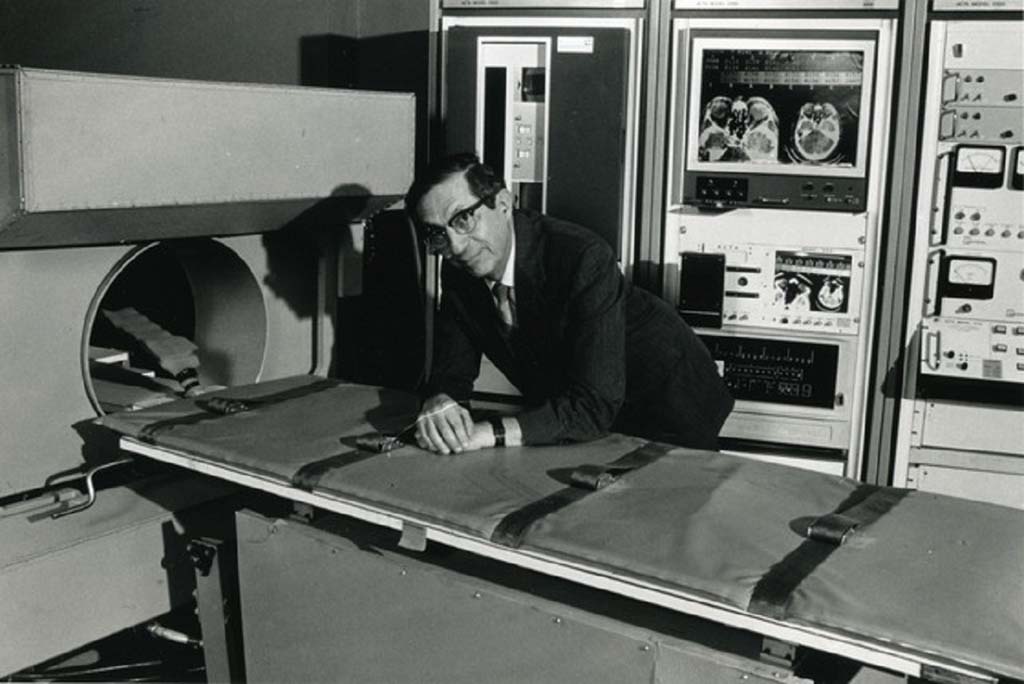
From left to right: Photograph of the Picker operator console shows the Polaroid camera mounted in front of the CRT display screen, the major components of the Picker CT system, and a radiologic technologist positioning a patient in the gantry.

Source: Picker Synerview sales brochures from Department of Radiology, Mayo Clinic
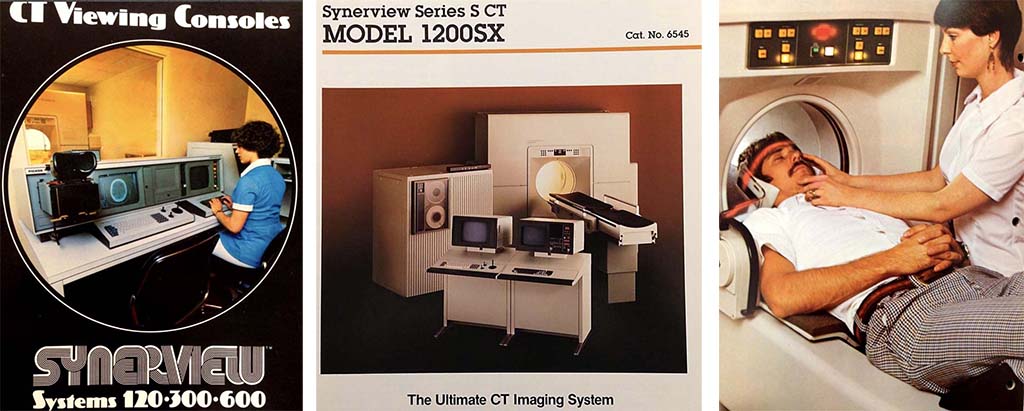
Picker 1200

1981

1982
26

In 1982, Simpson et al published their work describing the development of a CT system coupled to a therapy accelerator. The authors modified a Varian 4-MV isocentric therapy accelerator by mounting an array of detectors on a frame that was bolted to the counterweight end of the gantry. This geometry mimicked that of a 3rd generatio” CT scanner.

The authors envisioned that the system could provide 2- and 3-dimensional maps of electron density for CT-assisted therapy planning, aid in patient setup by providing cross-sectional views of the treatment volume, and allow periodic checking of the patient’s anatomical position relative to that used to generate the original treatment plan.

Source: Simpson RG, Chen CT, Grubbs EA, Swindell W. A 4-MV CT scanner for radiation therapy: the prototype system. Med Phys. 1982 Jul-Aug;9(4):574-9.

1984
27

In 1984, Imatron, Inc. installed a commercial electron-beam, ultrafast (5th generation) cine CT system at the University of California at San Francisco. The system was primarily used for imaging of the heart and used to calculate left ventricular volume and quantify the amount of coronary artery calcification. In 1986, a more conventional scan mode was added to facilitate imaging of the thorax, abdomen, and pelvis.

Source: Imatron C-100 sales brochure from Department of Radiology, Mayo Clinic

1990
28

The introduction of slip ring technology circumvented the need to rewind the gantry after each rotation. This enabled continuous data acquisition, including movement of the patient table during data collection. Interpolation of the projection data was required to avoid introducing motion artifacts. Spiral (or helical) CT was developed in 1989 by both Siemens and GE. AAPM William D. Coolidge awardee Willi Kalender played a major role in the ongoing development and adoption of the technique.

Sources: Kalender WA, Seissler W, Klotz E, Vock P. Spiral volumetric CT with single-breath-hold technique, continuous transport, and continuous scanner rotation. Radiology. 1990 Jul;176(1):181-3.

Source: Crawford CR, King KF. Computed tomography scanning with simultaneous patient translation. Med Phys. 1990 Nov-Dec;17(6):967-82.

29

From left to right: Photograph of the GE 9800 CT system with sample images, radiologic technologist at the system operating console, and a radiologic technologist using the magnetic tape storage system. This 3rd generation geometry system used solid-state scintillating detectors.

Source: GE 9800 sales brochures from Department of Radiology, Mayo Clinic
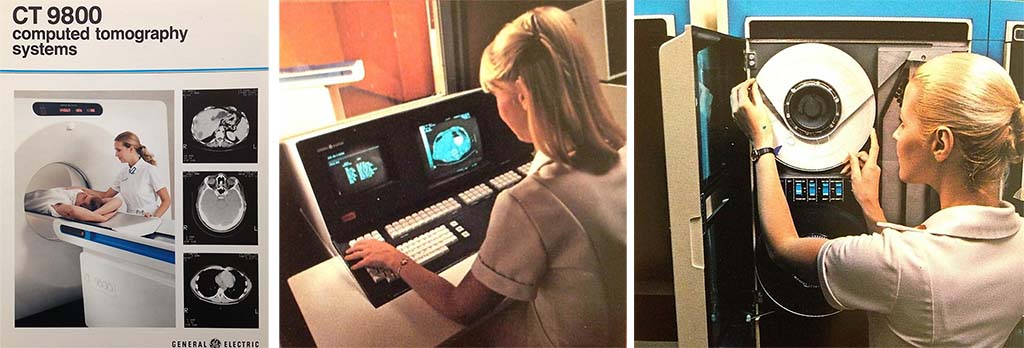
GE 9800

1991

1992
30

Spiral CT enabled volumetric image processing and rapidly advanced the field of CT angiography, essentially replacing diagnostic invasive angiography. A CT angiogram of the Circle of Willis from 1992 is shown. In the early days of spiral CT, the volume coverage along the z axis was limited to approximately 6 to 8 cm. A color volume rendering display of a CT angiogram of the head and neck circa 2015 is shown for comparison. Z axis coverage is no longer a limitation, and a single scan can cover the thorax, abdomen, pelvis, legs, and feet.

Source: Napel S, Marks MP, Rubin GD, Dake MD, McDonnell CH, Song SM, Enzmann DR, Jeffrey RB Jr. CT angiography with spiral CT and maximum intensity projection. Radiology. 1992 Nov;185(2):607-10.

Source: 2015 CT angiogram courtesy of Cynthia McCollough, Mayo Clinic

31

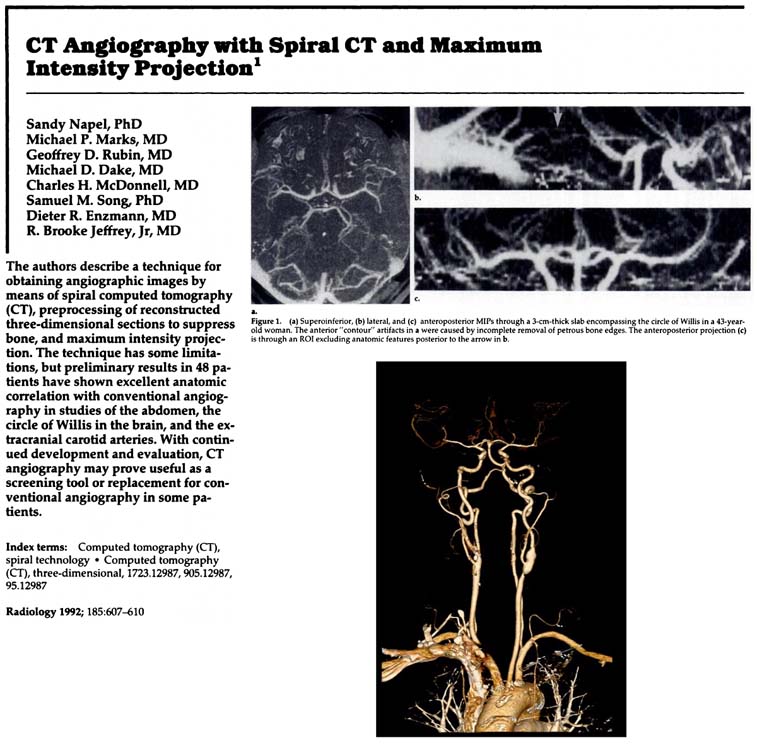
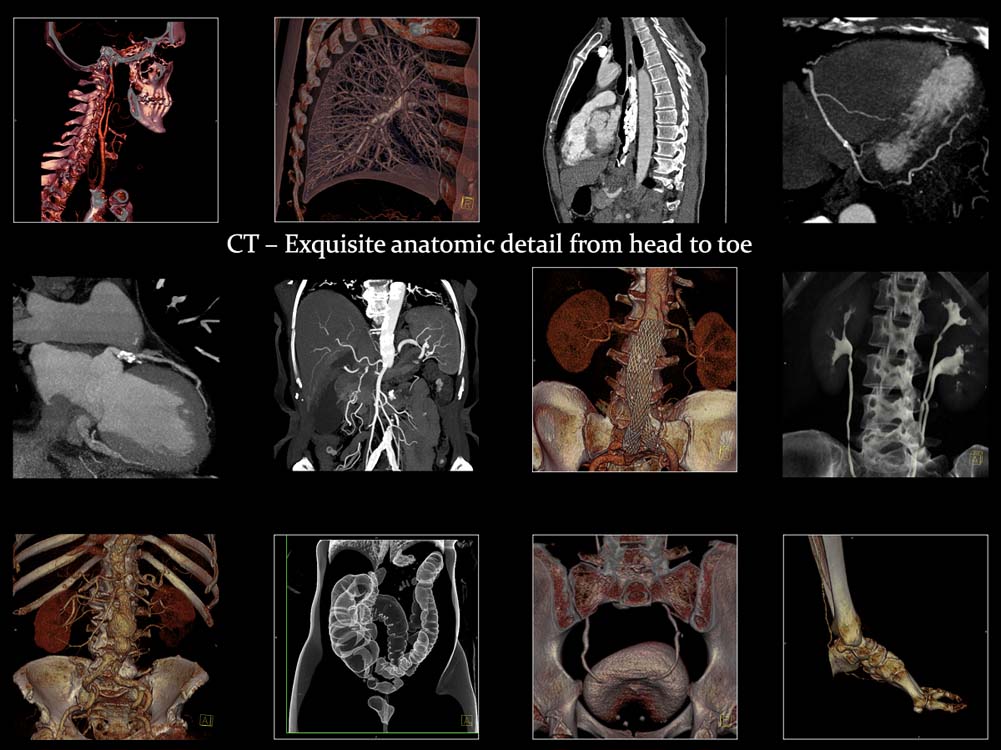
Advanced image visualization techniques were developed to visualize the 3-dimensional relationships within the spiral datasets. From left to right: Cover of special issue of Diagnostic Imaging dedicated to spiral CT, sagittal image of an aortic aneurysm, shaded surface display of a heavily calcified aorta and renal arteries, volume rendering of a portion of the kidneys and the renal arteries.

Source: Supplement to Diagnostic Imaging news magazine. November 1993
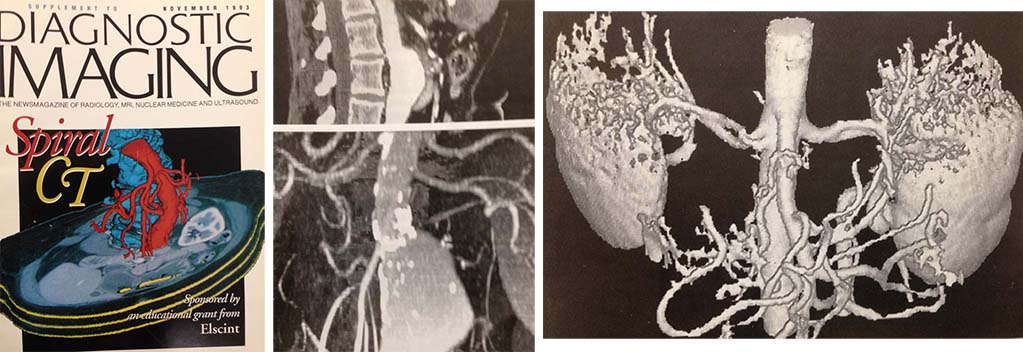
Aortic CTA

1992

1998
32

Both cone beam CT and multi-slice CT use a larger x-ray beam and detector along the patient’s long (z) axis to acquire to acquire multiple projections along z for any given view angle. This can be used to reduce scan time, increase z resolution, or both. The use of flat-panel detectors to acquire volumetric projection data expanded the use of CT to include in-office imaging of the teeth and jaw in dental and maxillofacial surgery practices, on-board imaging in radiation therapy, and intra-procedural use in interventional radiology suites.

Source: Mozzo P, Procacci C, Tacconi A, Martini PT, Andreis IB. A new volumetric CT machine for dental imaging based on the cone-beam technique: preliminary results. European radiology. 1998 Nov;8(9):1558-64.

1998
33

The continuous data acquisition enabled by spiral CT was difficult for then current x-ray tubes to accommodate. In addition to developments in tube technology, the introduction of multiple rows of detectors allowed more efficient use of the x-ray beam.

Source: James Kofler, III, Mayo Clinic

1999
34

Multi-slice (multi-detector-row) CT systems were commercially introduced by both Siemens and GE.

Source: Klingenbeck-Regn K, Schaller S, Flohr T, Ohnesorge B, Kopp AF, Baum U. Subsecond multi-slice computed tomography: basics and applications. Eur J Radiol. 1999 Aug;31(2):110-24.

Source: McCollough CH, Zink FE. Performance evaluation of a multi-slice CT system. Med Phys. 1999 Nov;26(11):2223-30.

2001
35

After the introduction of 4-slice multi-slice CT in 1998, manufacturers began to add more and more detector rows to their systems, initiating what has been referred to as the “slice race.”

Source: Cynthia McCollough, Mayo Clinic

2004
36

A variety of image rendering methods are used to convey to viewers the information contained within the isotropic datasets achieved using 64-slice CT technology.

Source: Cynthia McCollough, Mayo Clinic

2006
37

Dual source CT: Increasing the z-axis coverage per rotation decreased the overall time for a scan but did not improve the temporal resolution for any given image. Increasing gantry rotation speed improved temporal resolution in increasingly diminishing returns. To make a large improvement in per image temporal resolution, Siemens introduced dual-source CT, which added a second x-ray source in the same plane as the first source to improve the temporal resolution of cardiac CT images by a factor of two. To fit both sources onto the gantry, the field of view of the second sources was limited to 26 cm, which was adequate for cardiac imaging. The temporal resolution improved to 85 msec, approaching that of the cardiac mode on electron beam CT (50 msec).

Source: Cynthia McCollough, Mayo Clinic

2007
38

In Hounsfield’s 1973 BJR paper introducing CT, he stated that by collecting attenuation data using two different x-ray spectra, materials such as calcium and iodine could be differentiated due to the differences in how their attenuation changed as a function of photon energy. This concept, known as dual energy CT, was briefly introduced in the 1980s by Siemens, but was discontinued due to limitations in clinical utility due to the technology in use at that time.

Source: Johnson TR, Krauss B, Sedlmair M, Grasruck M, Bruder H, Morhard D, Fink C, Weckbach S, Lenhard M, Schmidt B, Flohr T, Reiser MF, Becker CR. Material differentiation by dual energy CT: initial experience. Eur Radiol. 2007 Jun;17(6):1510-7.

2010
39

The introduction of dual-source CT in 2006 allowed the acquisition of dual-energy data by operating the two sources at different tube potentials. Soon, other manufacturers introduced products that used a variety of technical approaches to acquire dual-energy data. These include the use of sequential scans at different tube potentials, split beam filters, dual-layer detectors, and rapid switching of the tube potential during one gantry rotation.

Source: Cynthia McCollough, Mayo Clinic

2007
40

Experimental photon counting detector CT systems in the 2000s paved the way for the development of the first photon counting detector CT scanner capable of imaging human subjects. In 2007, a prototype system from GE Healthcare with a 15-cm field-of-view scanned the first human subject with a photon counting detector CT at the Rabin Medical Center in Israel. Although operated at ~ 1/10th the tube current of a conventional CT system, prospective human studies were successfully performed in the neck and abdomen to demonstrate feasibility of the use of photon counting detectors in human CT imaging.

Source neck images: IEEE Transactions on Nuclear Science, Vol. 56, No. 3, June 2009

Source abdomen images: Cover, Diagnostic Imaging Europe Magazine, Nov. 2009

2014
41

Another human prototype system was manufactured by Siemens and installed at the Mayo Clinic in the summer of 2014 with a 27.5 cm field of view. Patient studies began in 2015 and increased after the installation of a 2nd Siemens system at the NIH Clinical Center and the installation of a Philips system in Lyon, France. A subsequent Siemens photon-counting-detector system was approved for sale in the United States by the FDA on September 30, 2021.

Photon counting detectors offer numerous advantages relative to the energy-integrating scintillating detectors used in conventional commercial CT systems. The limiting in-plane spatial resolution of the first Siemens’ photon counting detector system was 150 microns, with a minimum slice thickness of 250 microns. The resulting improvements in spatial resolution are demonstrated in this coronal image of a broken wrist.

Source: Cynthia McCollough, Mayo Clinic

2021
42

Ongoing developments in photon counting detector CT technology have led to systems capable of high-resolution multi-energy cardiac imaging at a temporal resolution of 63 msec. The improved spatial resolution decreases blooming artifacts from dense coronary calcifications.

Source: Cynthia McCollough, Mayo Clinic